

Training load is a baffling topic. After being confused by all of the different numbers coming from Garmin, Strava, intervals.icu and training peaks I finally decided to look in to what all of the numbers actually mean.
Understanding the numbers was the easy part. The deeper I dug the more I realised these numbers are drastic oversimplifications of complex systems and inherently flawed. But they are the best that we have and monitoring training load is a great tool for monitoring progression and preventing injury. So here’s what I found, and how to actually apply it to trail running.

What Exactly is Training Load?
Training load is defined as the stress an athlete experiences after completing a physical activity over a certain duration.
Training load is the combination of two elements: volume (time, dist, elevation) and intensity (how hard you are working). While typical volume metrics like time, distance, and elevation are important, they only tell part of the story because they neglect intensity relative to your fitness levels.
To get the full picture we must monitor both the work completed and how your body handled that work.
Internal vs. External Loads: The Two Critical Dimensions
The first major finding on my training load journey was the discovery that there is two categories of loads: external load and internal load.
External Load is the physical work completed; the external stimulus applied to the athlete.
Internal Load is how your body reacts to the external load; the cost the activity has on your internal systems.
It’s a bit like Newton’s third law, every action (external load) has a reaction (internal load), except the body’s ‘reaction’ isn’t fixed. The same stimulus can hit you differently depending on fatigue, life stress, or fitness, which is exactly why we track both sides separately.
The external load is the 5k run at 4:00km pace and the internal load is how my body responds to that stimulus, ie it generates heat, elevates heart rate and blood lactate levels rise. The sports science term for this is the dose-response relationship.
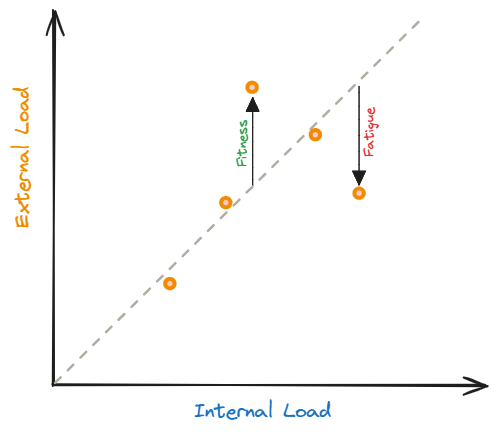
If training is progressing well then these two loads should correlate, there should be a linear relationship between them both. If your internal load is increasing compared to external load it can indicate that you are overtraining, fatigued or maladapting.
After this discovery I looked into all of the metrics I knew of and split them up into internal vs external. Then I reviewed them all to find the ones most relevant to trail running. Below is a venn diagram of load metrics and their categories. I won’t go into the specifics of all of the metrics in this post, but read on and I will discuss the ones I believe are most relevant to trail running.

Key Training Load Metrics for Trail Running
Trail running involves significant variability in grades, surfaces, and terrain, which makes standard training load metrics less straightforward to quantify. The best metrics to track for trail runners include specific measures of volume, external load, and internal load. I’ve boiled it down to a few critical volume measures, an external load metric and a couple of internal load metrics worth keeping an eye on.
These are the ones I consider worthwhile understanding and monitoring:
- Volume metrics: time and elevation gain/loss
- External load: rTSS
- Internal load: session RPE, HRV, resting HR average, hrTSS
Volume Metrics
The main volume metrics worth monitoring as a trail runner are:
- ⏱️ Time (hours and minutes)
- 🏔️ Elevation gain / loss (metres or feet)
- 📏 Distance (kilometres or miles)
In that order. Time being the most important. Time spent training at a certain intensity is the lever for adaption. Elevation gain is the next one to consider and one I often get the most obsessed with chasing when training for a big mountainous ultra. It’s important to match the elevation gradient of your goal event in training. Finally there is distance, the road runners favourite volume metric. It is not so useful on trails due to the diversity of terrain. Nevertheless it’s still a metric to keep and eye on.
But these metrics neglect intensity relative to fitness, that’s where load calculations come in.
Running Training Stress Score (rTSS) for External Load
If you’ve ever used TrainingPeaks or intervals.icu, you’ve probably heard of Training Stress Score (TSS). It’s a metric used to quantify the load of a workout by balancing volume and intensity relative to your current fitness.
TSS is anchored to your Functional Threshold Power (FTP), threshold pace, or threshold heart rate, essentially your max sustainable effort for about 60 minutes. It is calibrated such that 60 minutes at threshold intensity equals 100 TSS.
You can calculate TSS using:
- Power (external load)
- Pace (external load)
- Heart Rate (internal load)
Power is the favourite of cyclists. For runners, power calculations are dubious, so pace (rTSS) is the next best input.
The caveat: TSS is only as good as your inputs. If your threshold power, pace, or heart rate numbers are off, the resulting score is meaningless. You can estimate your threshold pace using a recent all-out 5K or 10K race time with this calculator. Then if you are using intervals.icu make sure you keep your threshold pace value up to date (see the image below on how to set it up).
rTSS — Running Training Stress Score
Session load- Baseline: 100 rTSS is equivalent to one hour at your running threshold pace.
- IF (Intensity Factor) is your grade adjusted pace (GAP) divided by threshold pace
- Needs an accurate threshold pace to mean anything, retest every few months as fitness changes.
The additional smart part about this calculation that makes it more relevant to trails is that it uses grade adjusted pace (GAP) to calculate the intensity factor, so it takes into account the impacts of large elevation gains on runs.
While it can take into consideration elevation to a certain degree, it doesn’t know the terrain you are moving over. It cannot account for technical trails and it also doesn’t factor in the fatigue incurred by steep descending which can be significant!

Session RPE (s-RPE) for Internal Load
Session RPE is a way of scoring each workout based on how hard it felt and generating a numerical value for the workout. The equation is super simple and the output is generally referred to as arbitrary units (AU). For best results you should score the workout straight after finishing.
sRPE — Session Rating of Perceived Exertion
Session load- Scale: RPE runs 0 (complete rest) to 10 (maximal effort), rated once, at the end of the session.
- No gear required — works for strength sessions, vert-heavy hiking, or anything a watch struggles to read cleanly.
- Highly subjective and pairs best alongside HR or pace data rather than replacing it entirely.
You can roughly correlate a workouts s-RPE with the equivalent TSS score using the table below. intervals.icu has the ability to calculate s-RPE if you do a post workout appraisal and enter the RPE value.
The issue with this metric is how highly subjective it is and I haven’t worked out how to treat a workout with intervals, where the interval might be 8/10 effort but the warm up and cool downs 4/10, the s-RPE value gets skewed up or down depending in how I decide to rank the workout.

Heart Rate Metrics
Morning HRV and Resting HR
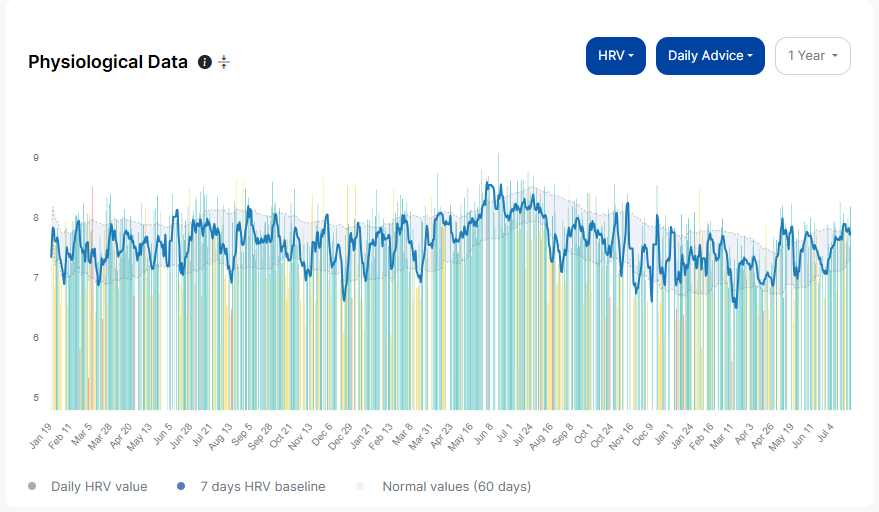
Monitoring heart rate variability and resting heart rate trends can be a great indicator of how well your body is tolerating training. These values need to be tracked over time to generate a normal range, then you can identify when they are deviating from the norm. Everyone has such unique values for HRV and RHR, so this is a fully individualised metric to track.
Generally speaking, if your HRV is falling and your resting heart rate is rising this can indicate you are getting sick, overtraining or fatigued. Noticing a trend can be a warning sign and it is smart to adapt training accordingly.
I use the HRV4Training app to do a 1 minute morning measurement. I’ve been habitually doing this for years. It is interesting noticing the how it trends up and down depending on life stressors, medications, sleep quality and training volume. I plan on doing a whole blog post about my morning HRV measurements and how they help me dynamically train.
Heart Rate TSS (hrTSS)
If you know your threshold heart rate, you can also calculate hrTSS. It uses the standard TSS equation but uses average HR of the workout and your threshold HR to calculate a TSS value. This isn’t an ideal metric because of the many factors that can impact your heart rate outside of running.
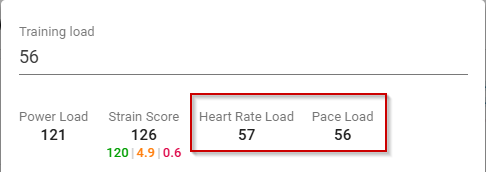
The main reason I like to monitor this is to see a like for like comparison of an external load (rTSS) and an internal load (hrTSS) that are both calibrated to the same scale. So if training is progressing well then each workout should have a similar rTSS and hrTSS.
If you click the load icon up the top of a workout in intervals.icu, it brings up a load dialog that shows pace, power and hr load. This is one of the ways to compare, you can also make graphs or add them in a table to monitor the correlation.


Subjective Feedback
This is not a metric as such, but maintaining a subjective training log with notes about each workout is a great way to monitor training. I sometimes keep notes in obsidian but these days I am gravitating more towards adding notes to workouts in intervals.icu, that way all my data is in one place.
Subjective feedback is especially important if you are coaching athletes, it can highlight problems that the numbers don’t show. A workout can look amazing on paper but to the athlete it may have felt like the hardest thing in the world. Good workout notes along with the numbers is the only way to see the full picture.
Monitoring and Planning Load over Time
Now that we have established ways to quantify the training load of individual workouts, the next step is to monitor these loads over time to ensure a smart progression.
Acute-Chronic Workload Ratio (ACWR)
Acute / Chronic workload ratio (ACWR) was the first load tracking method I ever adopted. It was after a visit to the podiatrist about a foot niggle that was caused by a ‘training error’. He explained this method of tracking workload over time and I went on to make a spreadsheet to monitor it. I haven’t had an injury ever since, it works for me (n =1 but I’ll take it).
ACWR is a simple ratio, it is the ratio of your short term training load (acute) to the long term load (chronic) and it can be applied to any training metric. There is a sweet spot, the ideal range for value of your ACWR is between 0.8 and 1.3. Getting too high above or below the sweet spot increases injury risk.
ACWR — Acute:Chronic Workload Ratio
Injury risk metric- Sweet Spot: The ideal range for reduced injury risk is 0.8 – 1.3.
- Danger Zone: An ACWR of > 1.5 indicates an increased injury risk.
- You can monitor ACWR using metrics like time, distance, elevation, rTSS, or s-RPE.
I use ACWR to plan my seasons, if you check out my long range planner spreadsheet I include a calculation for ACWR going forward for time, distance and elevation gain. I am a risk averse person so I like to ensure I am staying in the safe zone when I am building up to high volumes. I also track ACWR in intervals.icu, there is a great graph for it that tracks ACWR of TSS.

CTL, ATL and TSB
CTL, ATL and TSB are the components of the fitness graph we commonly see on Training Peaks or intervals.icu. They take daily TSS scores and average them over time. This gives insight into daily and weekly training loads relative to the long term trend.
Together, CTL, ATL, and TSB tell the story of a training block on a single graph.

CTL (Chronic Training Load) is your "fitness" line, a slow-moving average of your training over the last several weeks, so it only climbs when you've been consistently putting in work, and only drops when you've backed off for a while. Your CTL roughly translates to your average daily TSS in recent weeks.
ATL (Acute Training Load) is your "fatigue" line, the same idea, but over just the last week, so it reacts almost immediately to a hard session or a big weekend.
TSB (Training Stress Balance), or "form," is simply the gap between the two: CTL minus ATL. When ATL is riding above CTL, TSB goes negative and you're carrying more fatigue than your fitness has caught up to, normal, and expected, in the middle of a solid training block. When CTL pulls ahead of ATL, TSB turns positive, which is what you're chasing in the days before a race: fit, but no longer buried under the fatigue of getting there.
CTL — Chronic Training Load (Fitness)
Fitness model- Slow mover: a 42-day time constant means CTL only shifts meaningfully over weeks, not days.
- Rising CTL over a training block generally reflects a growing aerobic base.
ATL — Acute Training Load (Fatigue)
Fitness model- Fast mover: a 7-day time constant means ATL reacts quickly to a hard week.
- A spike in ATL after a big vert weekend is expected, the question is whether it comes back down.
- Chronically elevated ATL relative to CTL is an early warning sign of overreaching.
TSB — Training Stress Balance (Form)
Fitness model- Positive TSB: fitness is outweighing fatigue, you're arriving fresh, useful heading into a race.
- Negative TSB: fatigue is outweighing fitness, normal mid-block, riskier close to race day.
TSB recommended ranges for race readiness (this correlates to the zones shown on the TSB graph)
- Intensive Training (Building Fitness): -10 to -30 (Caution: below -30 increases injury/illness risk).
- Recovery Weeks (Allowing Adaptation): +5 to +15.
- Pre-Race (Taper) (Reducing Fatigue for Peak Performance): +5 to +25 (Aim is often around +5 for race day).
- Losing Fitness (Training too easy): Above +25.
The Metrics and Their Flaws
Every metric in this post is a proxy, not a direct measurement. None of them know how your foot actually loaded on a technical descent, what your legs feel like six hours into a race, or whether you're fighting off a cold. Here's where each one breaks down.
| Metric | Flaws |
|---|---|
| Volume (time, distance, elevation) | Says nothing about intensity, a recovery jog and a hill session can look identical |
| rTSS | Blind to technical terrain and steep-descent fatigue; entirely dependent on an accurate, current threshold pace |
| sRPE | One subjective rating for the whole session, gets skewed by whichever part (hard intervals vs. easy warm-up) sticks out most in memory |
| HRV / Resting HR | Noisy; sleep, alcohol, heat, and illness move it as much as training does; needs weeks of baseline before a single reading means anything |
| hrTSS | HR lags true effort and is distorted by heat, hydration, caffeine, cardiac drift, and altitude |
| ACWR | The sweet spot is based on research but still not guaranteed to prevent injury |
| CTL / ATL / TSB | Inherits every flaw already baked into TSS; the 42/7-day time constants are somewhat arbitrary, not personalised; CTL can be inflated with junk volume without real fitness gains |
The common thread: almost every one of these metrics is built on top of TSS in some form, so an inaccurate threshold estimate doesn't just wreck one number, it cascades through rTSS, hrTSS, ACWR, CTL, ATL, and TSB simultaneously. That's the real argument for pairing the numbers with subjective feedback rather than trusting any single line on a graph.
If you want some further reading, this post made me question everything about load metrics. But at the end of the day I still think they are useful despite their flaws. If you know their flaws then you know their limitations of applicability.
🔗 The Illusion of Training Load Quantification: What Really Matters by Manuel Sola Arjona
Practical Take-Aways for Trail Runners
So, is training load still baffling? Definitely. But hopefully less so now. None of these metrics are precise measurements of what's happening in your body, they're approximations, stitched together from data your watch can and can't see. rTSS doesn't know about the technical quad bash, sRPE doesn't know your mood swung the rating, CTL doesn't know the difference between real fitness and junk volume. But flawed doesn't mean useless. Used together, these metrics cover for each other's blind spots far better than any one of them does alone.
Effective training load management comes down to balancing sufficient stimulus with adequate recovery, so your body actually gets to adapt rather than break down. A few practical rules I've landed on:
- Monitor both sides: rTSS (external, leveraging GAP) and sRPE (internal) together give the best read on variable terrain. HRV and subjective journalling add a second layer of internal load.
- Track the long game: use ACWR or the CTL/ATL/TSB performance chart to manage load planning over weeks and months, not just single sessions.
- Maintain a subjective log: the same external load can hit two people, or the same person on two different weeks very differently, depending on fitness, training history, and life stress. The numbers alone don't capture that.
- The golden rule: never increase volume and intensity at the same time.
Understanding the numbers is the first step; deciding how to actually apply them is the next. Monitoring training load is a lot like adjusting tyre pressure: too low, and you're slow and risking wear; too high, and you're one bump from a blow-out. Dialled in right, and you roll smoothly across whatever terrain is in front of you.

Joseph Nunn: An avid trail runner based in Hobart, Tasmania. He loves getting out for big days on the trails with mates or racing against them.
Want to read more content like this? Subscribe to my blog and get new posts delivered straight to your inbox every 2 weeks.
Wow. You have excelled. Good to have you coaching George to make sense of all this. Having been injured with an ankle fracture since end-May, there’s zero metrics being recorded by me – not that I was really doing anything more than a very slow parkrun shuffle before anyway.